The Program Report provides an overview of student performance for all (or selected) tests and test windows in a program. This report is available to roles with permission to view it, such as district and school administrators.
Access the Program Report
- Select Reporting > Performance.
- Select a Program.
- Select the Program Report button.
Classic User Interface:

Updated User Interface:

View the Program Report
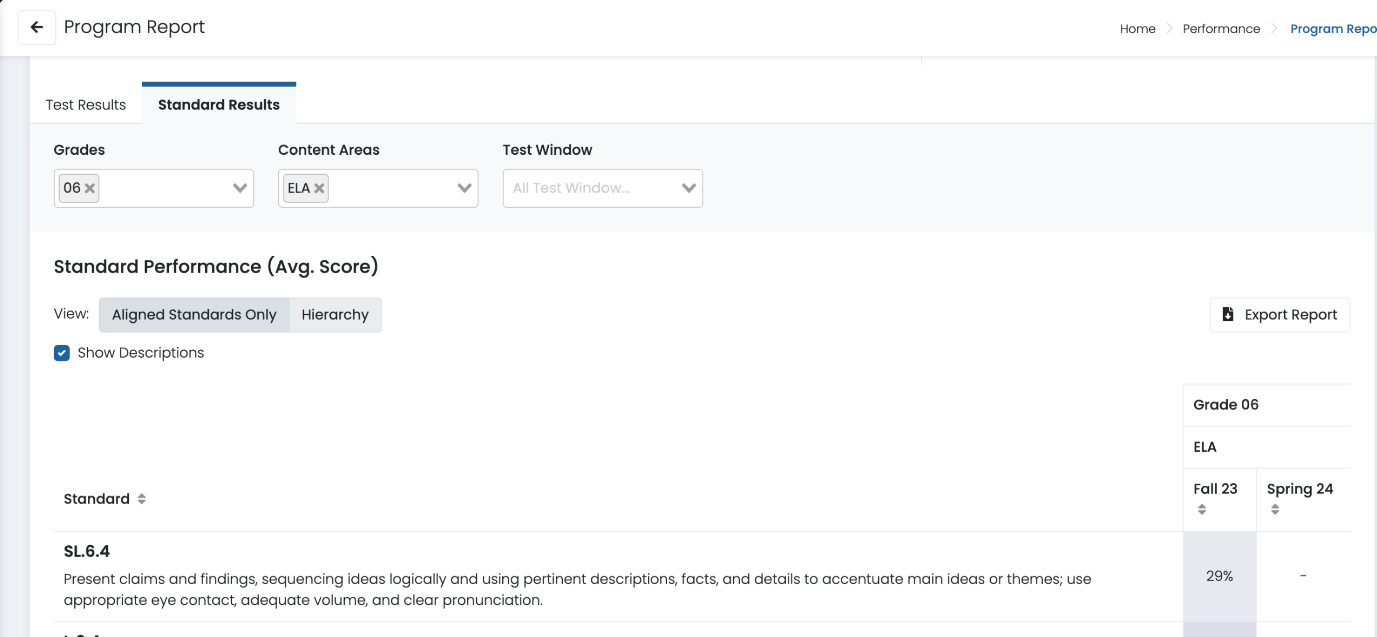
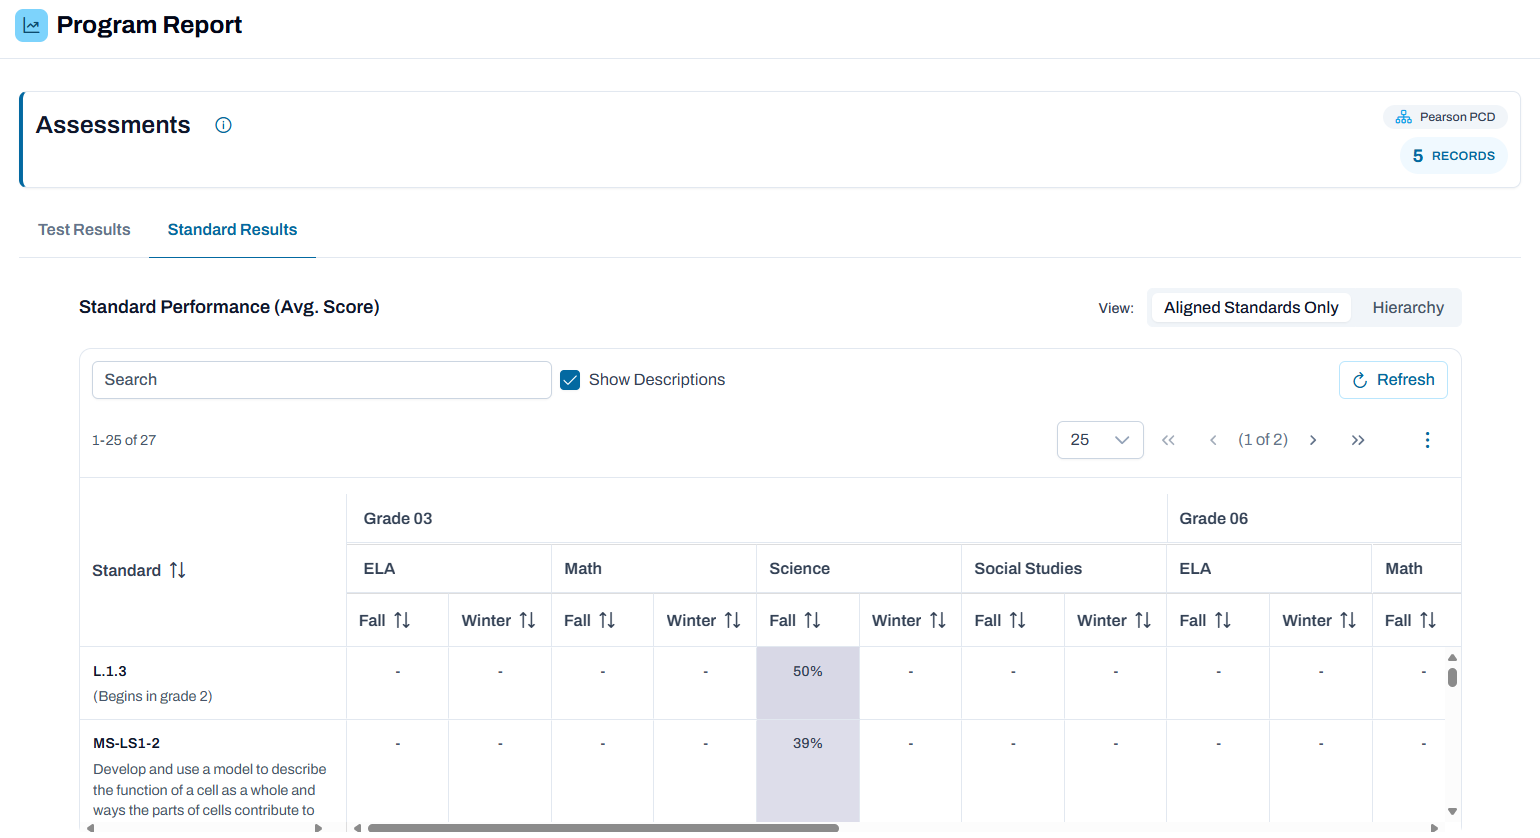
You can configure the report in several ways. Available filtering options and actions can vary, depending on your program.
- Scope: Select an institution. Inside the dropdown, select an arrow to expand the list of child institutions. Only the institutions you have access to appear.
- Grades: Add or remove grade level filters. This is the grade level assigned to the tests, not the students. By default, all grades are selected.
- Content Areas: Add or remove content area filters.
- Test Windows: Add or remove test window filters.
- Administration: Add or remove specific test administrations. This is a filter only, not a column in the report.
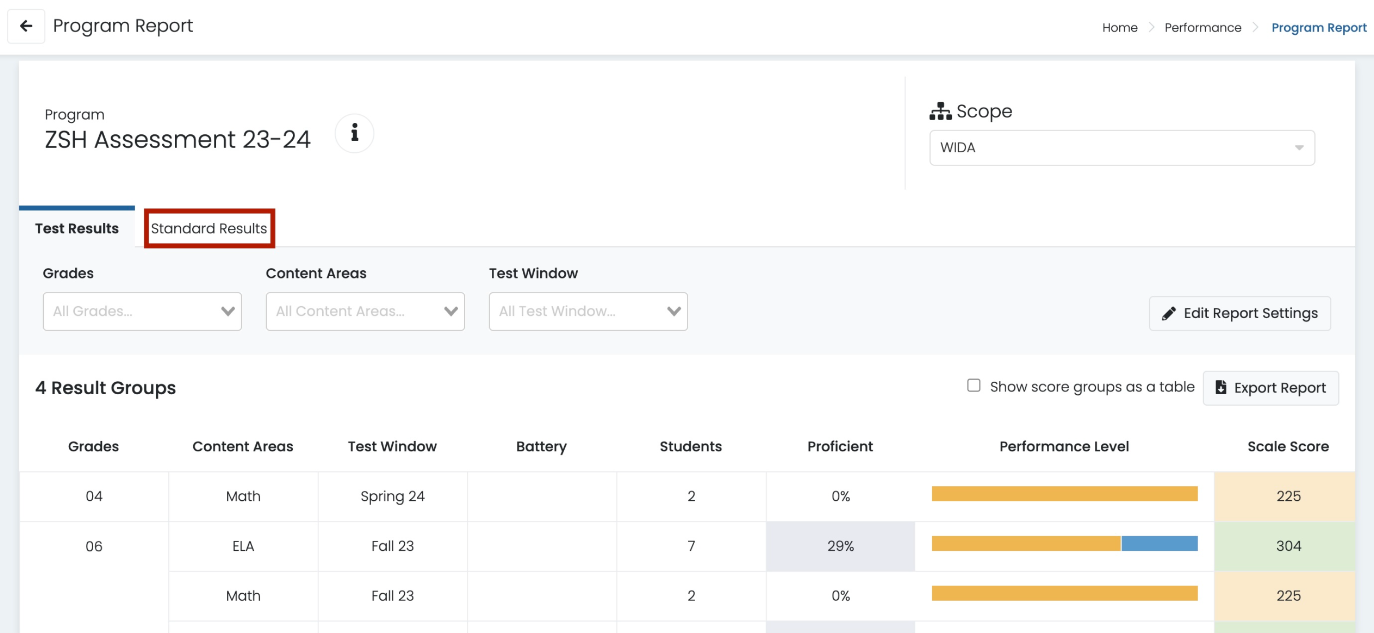
- Show score groups as a table: Select the checkbox to show the Performance Level column as a table. This checkbox is only available if Performance Level is used in the program.
- Export Report: Select the button to export the report as a CSV file.
Classic User Interface:
Updated User Interface:

Classic User Interface:
Updated User Interface:
Modify Reporting Settings
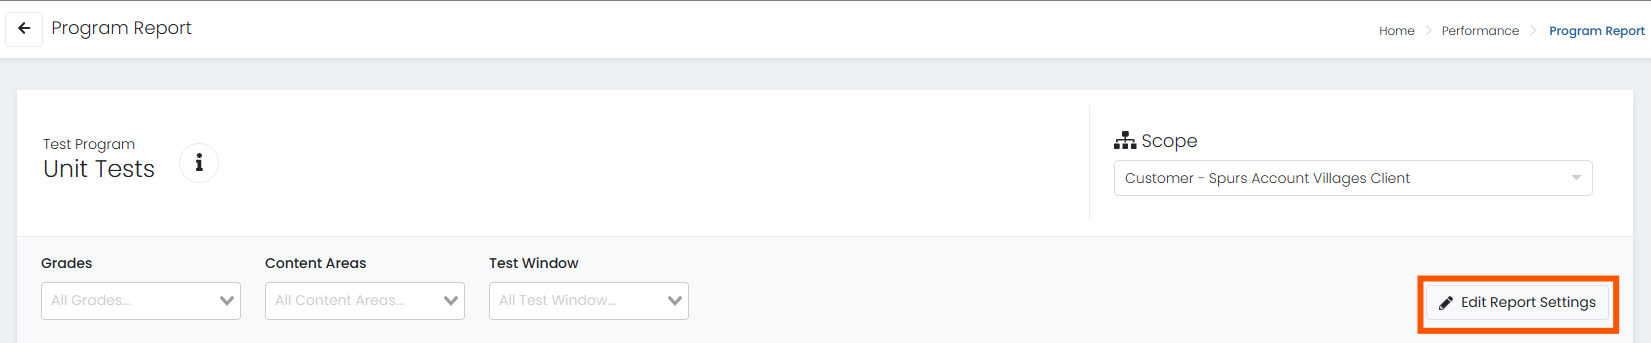
If your program is configured to allow it, you can select Edit Report Settings to modify report settings.
Classic User Interface:
Updated User Interface:
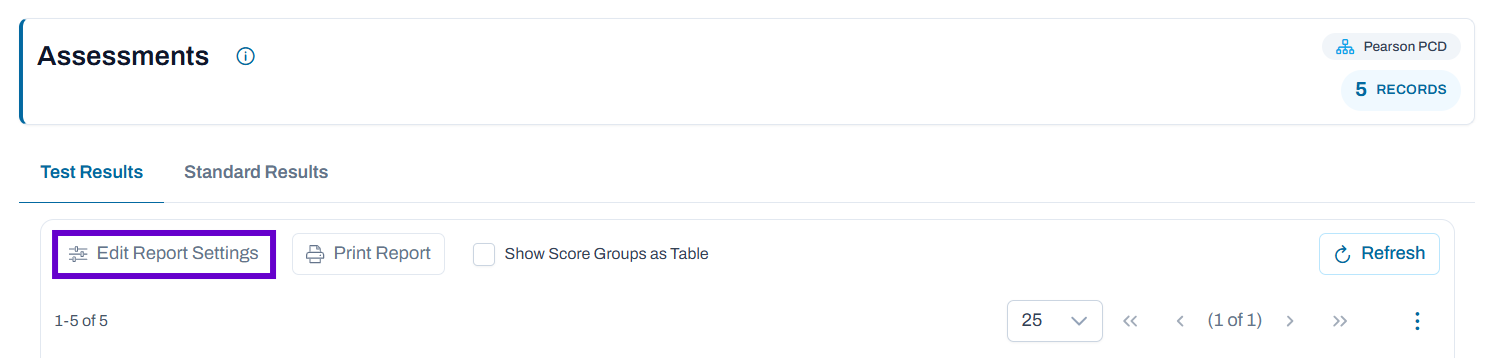
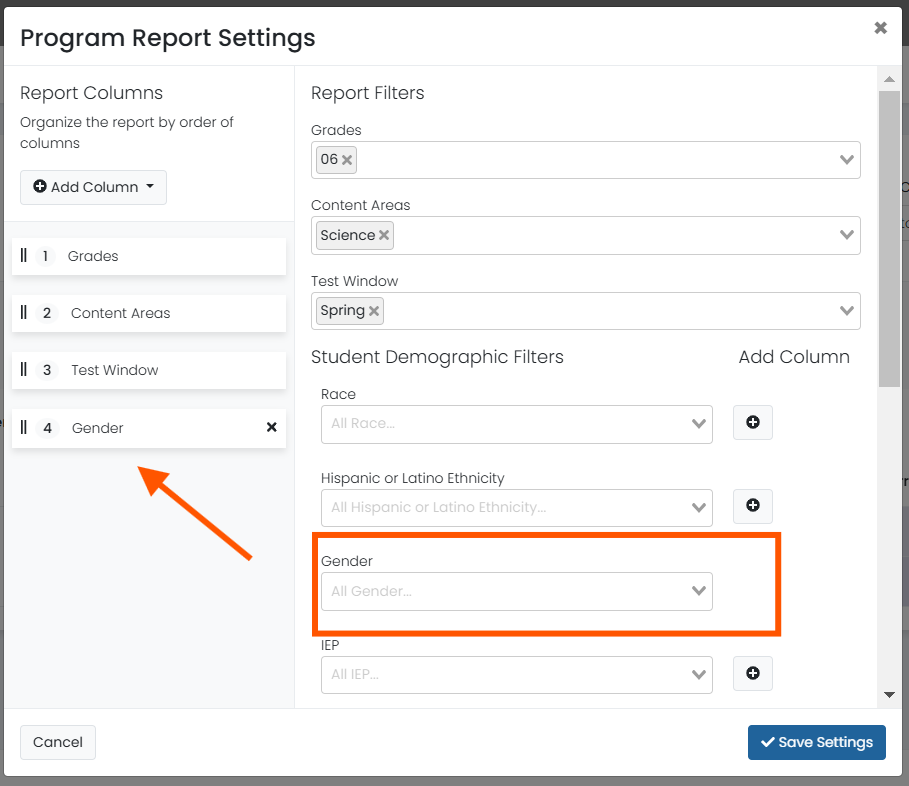
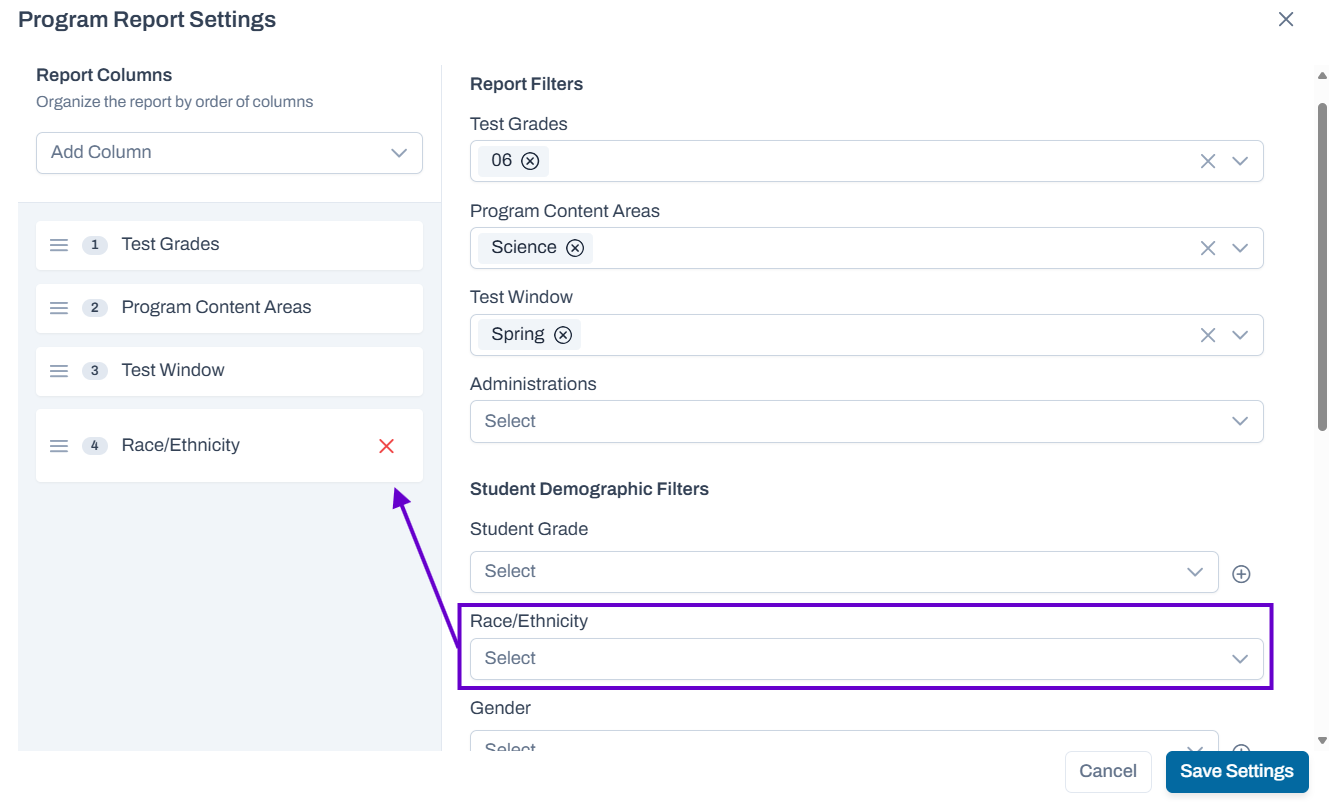
Options available in Report Settings:
- Reorder Columns: Drag and drop the column headers to change their position.
- Report Filters: Filter by Grades, Content Areas, or Test Windows. You can select multiple values for each filter. These filters can also be applied on the main report page.
- Student Demographic Filters: If available in your system, filter by Race, Hispanic or Latino Ethnicity, or Gender. You can select multiple values for each filter. Select the plus icon to add a filter as a report column.
- Add Column: Add a new column, such as Race or Gender.
Classic User Interface:
Updated User Interface:
Tiny Link: https://support.assessment.pearson.com/x/YwUgBg